グラフの自動レイアウトに挑戦 #1 グラフ構造をSVGで表示
2022-08-12 13:50:22
作成したアプリケーションとソースコード
- アプリケーション: https://refd6y.csb.app/ (ブラウザで実行します)
- ソースコード: https://codesandbox.io/s/graph-layout1-refd6y
はじめに
連載記事のトップのところに書いた図はこのようなものだ。
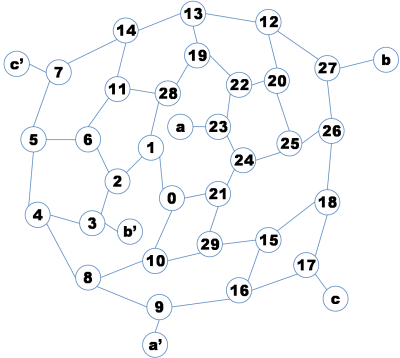
これをコンピュータに自動配置させたい。
Eadesのばねモデル
このような、つながった複数の物体をコンピュータに自動配置させるのは「グラフ描画」または「グラフレイアウト」と呼ばれる分野であり、さまざまなアルゴリズムが研究されている。この連載記事では比較的単純な「Eadesのばねモデル」というアルゴリズムを採用する。
Eadesのばねモデルとは、次のようなモデルをつくって物理シミュレーションすることで、物体を配置するアルゴリズムだ。
- 各ノード(頂点)は、質点、つまり質量はあるけれども体積が0の理想物体と仮定する。
- エッジ(頂点と頂点をつなぐ線)は、ある長さのばねでできていると仮定する。ばねは元の長さより長いと縮もうとするし、元の長さより短いと伸びようとする。
- ノード同士には反発力が働く。反発力は磁石のN極とN極みたいに、遠ければ遠いほど力が弱まる。
……ここであらかじめネタばらししておくと、Eadesのばねモデルでは、上の図のような配置を得ることはできない。線が重ならないように配置させるにはもっと複雑なモデルを使わないといけない。ではどのようなモデルならいいのか?その答えはこの記事の範囲を超えるので、興味を持った人が各自で調べてほしい。ごめんなさい。
とりあえず、この連載記事のゴールは「Eadesのばねモデルを実装して動かしてみる」に設定する。では早速コードを書いていこう。
グラフ構造
まずは、ノードとエッジのデータ構造を考える。実現方法はいろいろあるが、今回はノードもエッジも、オブジェクトの配列として持つことにする。
ノードオブジェクト配列はこんな感じ。
/**
 * @typedef {Object} Node - ノードオブジェクト
 * @property {string} name - 表示されるラベル名
 * @property {number[]} links - 繋がっているノードの、nodes配列上のインデックス
 * @property {x: number, y:number} r - 位置
 * @property {x: number, y:number} v - 速度
 * @property {Element} element - SVGエレメント
 */

/**
 * @type {Node[]} - ノードオブジェクトの配列
 */
const nodes = [{
    name: "0",
    links: [1, 10, 21],
    r: {x: 0, y: 0},
    ...
}, {
    name: "1",
    links: [0, 2, 28],
    r: {x: -20, y: 50},
    ...
}, ... ];
エッジオブジェクト配列はこんな感じ。
/**
 * @typedef {Object} Edge - エッジオブジェクト
 * @property {number} n0 - nodes配列上のインデックスの、小さい方
 * @property {number} n1 - nodes配列上のインデックスの、大きい方
 * @property {Element} element - SVGエレメント
 */

/**
 * @type {Edge[]} - エッジオブジェクトの配列
 */
const edges = [{
    n0: 0,
    n1: 1,
    ...
}, {
    n0: 0,
    n1: 10,
    ...
}, ... ];
しかし、今回のグラフはノードが30個以上ある。このようなオブジェクト配列を手で描くのは面倒だし、描き間違いをしてしまうかもしれない。
そこで、ノード同士の連結を表現した文字列を初期データとして、これをもとにグラフを初期化することにした。
const data =
    "0,1 0,10 0,21 1,2 1,28 2,3 2,6 3,4 3,b' " +
    "4,5 4,8 5,6 5,7 6,11 7,14 7,c' 8,9 8,10 9,16 9,a' 10,29 " +
    "11,14 11,28 12,13 12,20 12,27 13,14 13,19 15,16 15,18 15,29 " +
    "16,17 17,18 17,c 18,26 19,22 19,28 20,22 20,25 21,24 21,29 " +
    "22,23 23,24 23,a 24,25 25,26 26,27 27,b";
この文字列をスペースやカンマで分割して、ノードとエッジを作っていく。
const init = (data) => {
    const findByNameOrAdd = (name) => {
        const index = nodes.findIndex((n) => n.name === name);
        if (0 <= index) {
            return index;
        }
        nodes.push({
            name: name,
            links: [],
            r: { x: 0, y: 0 },
            v: { x: 0, y: 0 }
        });
        return nodes.length - 1;
    };

    for (const l of data.split(" ")) {
        const names = l.split(",");
        const n0 = findByNameOrAdd(names[0]);
        const n1 = findByNameOrAdd(names[1]);
        nodes[n0].links.push(n1);
        nodes[n1].links.push(n0);
        edges.push({
            n0: n0,
            n1: n1
        });
    }
};
このデータを表示するために、今回はSVGを使う。
<svg id="svg" width="800" height="800" viewBox="0 0 800 800" xmlns="http://www.w3.org/2000/svg">
   <g id="g" transform="translate(400, 400)"><!-- 原点(0, 0)を中心に表示するように並行移動している -->
      <rect x="-400" y="-400" width="800" height="800" fill="#eef" stroke="none"></rect>
      <!-- この位置に円や直線のエレメントを挿入する -->
   </g>
</svg>
<g>要素の子にエッジ(線)とノード(円+テキスト)を追加していく。エッジから先に追加しているのは、後から追加したものほど手前に表示されるから。
const createElements = () => {
    const svg = "http://www.w3.org/2000/svg";
    const root = document.getElementById("g");

    for (const edge of edges) {
        const n0 = nodes[edge.n0];
        const n1 = nodes[edge.n1];
        const line = document.createElementNS(svg, "line");
        edge.element = line;
        line.setAttribute("x1", n0.r.x);
        line.setAttribute("y1", n0.r.y);
        line.setAttribute("x2", n1.r.x);
        line.setAttribute("y2", n1.r.y);
        line.style.stroke = "blue";
        root.appendChild(line);
    }

    for (const node of nodes) {
        const name = node.name;
        const r = node.r;
        const g = document.createElementNS(svg, "g");
        node.element = g;
        g.style.transform = `translate(${r.x}px, ${r.y}px)`;
        const index = nodes.findIndex((n) => n.name === name); // HACK: Part3で使う
        g.dataset.index = index; // HACK: Part3で使う
        root.appendChild(g);
        const circle = document.createElementNS(svg, "circle");
        circle.setAttribute("r", "20");
        circle.style.stroke = "blue";
        circle.style.strokeWidth = "1";
        circle.style.fill = "white";
        g.appendChild(circle);
        const text = document.createElementNS(svg, "text");
        text.style.stroke = "black";
        text.style.textAnchor = "middle";
        text.style.dominantBaseline = "central";
        text.style.fontSize = "16px";
        text.textContent = name;
        g.appendChild(text);
    }
};
しかし、ノードの表示位置がすべて原点 (0, 0) なので、このまま表示しても面白くない。 そこで、初期配置として、原点の周りに円形に並べてみる。
const arrangeInCircle = (r) => {
    for (let i = 0; i < nodes.length; i++) {
        const theta = 2 * Math.PI * (i / nodes.length);
        const node = nodes[i];
        node.r.x = r * Math.cos(theta);
        node.r.y = r * Math.sin(theta);
    }
};
Part1はここまで。実行すると、ノードが円形に配置され、いくつかのノードがエッジでつながっている様子が表示される。